This issue was published 2 days late; it was due on Thursday 5 November 2026 (25 Jumada al-Ula 1448 AH).
Value of card spending 3.8% lower than last year
Value of point-of-sale payments in Saudi Arabia · week 25–31 October 2026 · 14–20 Jumada al-Ula 1448 AH
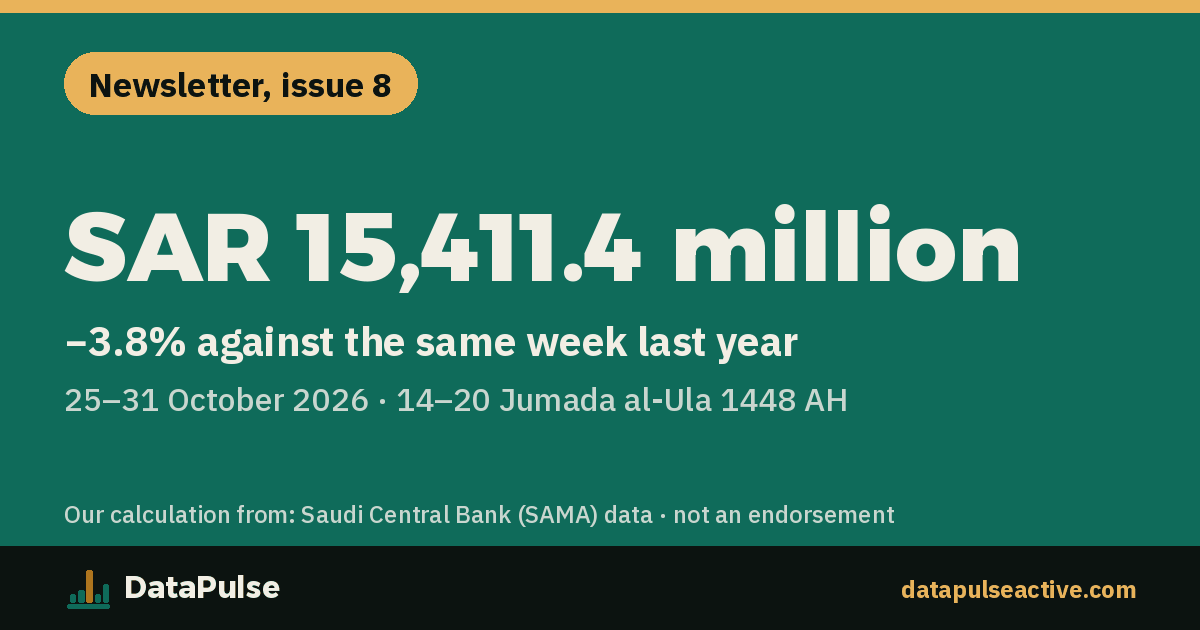
SAR 15,411.4 million
−3.8% against the same week last year (SAR 16,027.3 million).
| This week | Same week last year | Change | |
|---|---|---|---|
| Number of transactions (million) | 264.9 | 254.5 | +4.1% |
| Average transaction value (SAR) = value ÷ number | 58.2 | 63.0 | −7.6% |
What this means for your decision: Spending in Saudi Arabia in the last 4 weeks was close to last year (less than 0.1%); a large change in your sales is not explained by the market, as a comparison with your city and activity shows.
The week and its counterpart last year have no Ramadan or Eid, and both have the same events, so the year-on-year comparison is seasonally like for like.
Three points
- Against the previous week +30.8%, and over the same two weeks last year +37.1%; a weaker move than last year’s pattern.
- 5 of 19 main activities are above last year; fastest growth Jewellery +48.1%, weakest Hotels −36.7%.
- Among the 10 largest cities, 1 are above last year; fastest Buraidah +4.7%, slowest Tabuk −14.4%.
Spending above the previous year in 44 of 52 weeks
Weekly point-of-sale payments in Saudi Arabia, 2 November 2025 – 31 October 2026 · 11 Jumada al-Ula 1447 – 20 Jumada al-Ula 1448 AH, against the same weeks 364 days earlier. Shaded: Ramadan and the two Eids this year; their Gregorian dates differ in the previous year.
[1]What this means for your decision: The 4-week trend (above) says more than a single week.
Jewellery fastest-growing, Hotels weakest this week
Change in spending by main activity against the same week last year, %.
| Activity | SAR million | Million transactions | Average transaction (SAR) |
|---|---|---|---|
| Jewellery | 619.6 +48.1% | 0.4 +37.8% | 1,383.1 +7.4% |
| Telecommunications | 302.0 +24.7% | 6.0 +23.2% | 50.1 +1.2% |
| Public utilities | 73.3 +24.3% | 1.1 +31.5% | 65.7 −5.4% |
| Groceries and food | 2,802.9 +5.2% | 62.8 +9.5% | 44.6 −4.0% |
| Restaurants and cafés | 1,899.8 +3.5% | 63.6 +3.8% | 29.9 −0.4% |
| Building materials | 438.0 −0.6% | 3.5 +35.4% | 125.2 −26.5% |
| Culture and recreation | 369.5 −0.8% | 4.3 −4.9% | 85.3 +4.3% |
| Fuel stations | 1,107.5 −0.8% | 19.3 +1.0% | 57.4 −1.8% |
| Laundry | 66.6 −4.3% | 3.2 −1.6% | 20.6 −2.8% |
| Health | 961.2 −5.5% | 11.1 −6.5% | 86.8 +1.1% |
| Clothing and accessories | 1,290.3 −5.6% | 11.1 −0.1% | 116.0 −5.5% |
| Transport | 1,101.7 −5.9% | 8.0 +16.4% | 138.4 −19.1% |
| Electronics | 199.9 −9.2% | 2.2 +7.6% | 91.3 −15.7% |
| Bakeries and sweets | 275.0 −11.4% | 6.8 −17.5% | 40.5 +7.4% |
| Other activities | 2,312.1 −13.8% | 42.6 −2.3% | 54.3 −11.7% |
| Professional services | 745.2 −14.4% | 14.7 +17.6% | 50.5 −27.2% |
| Furniture and home | 485.4 −19.9% | 3.1 +3.7% | 158.9 −22.7% |
| Education | 123.4 −34.8% | 0.2 −15.0% | 660.1 −23.3% |
| Hotels | 237.8 −36.7% | 0.8 −4.3% | 295.5 −33.9%[1] |
What this means for your decision: In the weakest activities demand is falling across the market; in the fastest, a shop growing more slowly than its activity is losing part of its share.
Buraidah fastest-growing of the 10 largest cities
Weekly spending of the 10 largest cities, SAR million.
| City | SAR million | vs previous week | vs same week last year | Million transactions | Average transaction (SAR) |
|---|---|---|---|---|---|
| 1. Riyadh | 5,326.6 | +26.5% | −2.5% | 88.1 +6.5% | 60.5 −8.4% |
| 2. Jeddah | 1,971.4 | +23.2% | −3.8% | 29.2 +0.9% | 67.5 −4.7% |
| 3. Dammam | 747.9 | +24.3% | −2.4% | 10.5 +1.2% | 71.3 −3.6% |
| 4. Madinah | 611.9 | +30.7% | −3.8% | 10.1 −0.8% | 60.7 −3.1% |
| 5. Makkah | 586.9 | +25.4% | −9.8% | 10.1 +1.2% | 58.2 −10.9% |
| 6. Al Khobar | 427.7 | +24.3% | −2.7% | 5.4 +3.3% | 79.3 −5.9% |
| 7. Buraidah | 405.7 | +27.8% | +4.7% | 6.0 +5.8% | 67.1 −1.0% |
| 8. Taif | 346.1 | +42.5% | −8.1% | 6.6 −2.1% | 52.8 −6.1% |
| 9. Khamis Mushait | 305.6 | +37.8% | −12.0% | 4.5 −7.5% | 68.6 −4.8% |
| 10. Tabuk | 291.5 | +52.6% | −14.4% | 5.2 −7.0% | 55.9 −7.9%[2] |
After inflation, by region (estimate)
Change in the value of spending against the same week last year, before and after removing the rise in prices in the region: (1 + change) ÷ (1 + inflation) − 1.
| Region | Before removing price rises | Annual inflation | After inflation (estimate) | Cities |
|---|---|---|---|---|
| Saudi Arabia | −3.8% | +1.9% | −5.6% | all |
| Riyadh | −2.6% | +2.3% | −4.7% | 10 |
| Makkah | −5.8% | +2.1% | −7.7% | 6 |
| Eastern Province | −2.6% | +1.9% | −4.4% | 12 |
| Madinah | −5.8% | +1.5% | −7.2% | 3 |
| Qassim | +2.6% | −1.3% | +3.9% | 5 |
| Asir | −10.1% | +1.5% | −11.5% | 5 |
| Tabuk | −14.5% | +1.2% | −15.6% | 2 |
| Hail | −5.7% | +2.1% | −7.6% | 1 |
| Jazan | −14.6% | +0.6% | −15.1% | 7 |
| Najran | −8.9% | +2.0% | −10.7% | 2 |
| Al-Baha | −8.4% | +1.7% | −9.9% | 1 |
| Al-Jouf | −10.2% | +4.2% | −13.9% | 3 |
| Northern Borders | −4.9% | +3.6% | −8.2% | 3[3] |
The attribution statement in Arabic (the Arabic text governs)
مبني على بيانات الهيئة العامة للإحصاء مع تعديل ودمج وحساب من «نبض البيانات»؛ ليس إحصاءً رسميًا ولا تزكية من الهيئة.
Estimate: a monthly regional inflation rate applied to one week, and the consumer basket does not match the card-spending basket. A region = the sum of its cities published by SAMA; “other cities” count towards Saudi Arabia only.
What this means for your decision: Saudi Arabia (−3.8%) is the reference for cities: those below it had a weaker local market this week, which does not mean your shop is weaker.
Calendar of the coming weeks
Announced calendar facts only, no forecasts.
Also present last year, so the comparison is balanced:
- 22–28 November 2026 · 12–18 Jumada al-Akhirah 1448 AH: Government salaries on Thursday 26 November (16 Jumada al-Akhirah 1448 AH) (Ministry of Finance schedule).
Ramadan 1448 AH starts around Monday 8 February 2027 (1 Ramadan 1448 AH) by the Umm al-Qura calendar (the official start is by moon sighting), in 13 weeks.
What this means for your decision: The salary week was 19.5% higher than the average ordinary week over the last 52 weeks.
Figure of the week from outside spending
The e-commerce in wholesale and retail trade index (2023 average = 100) was 146.1 in Q2 2026 (Shawwal 1447 – Muharram 1448 AH), a change of +9.8% from the same quarter a year earlier. GASTAT publishes it quarterly; it shows the trend of traders’ activity from the establishments’ own data, not from card payments.[4]
Published by GASTAT on 27 August 2026 (14 Rabi' al-Awwal 1448 AH). Details on the trade page. Reuse terms: GASTAT data use policy.
The attribution statement in Arabic (the Arabic text governs; the English above is a summary)
المصدر: الهيئة العامة للإحصاء — مؤشرات تجارة الجملة والتجزئة. التنظيم والحساب من «نبض البيانات»، وليس إحصاءً رسميًا ولا تزكية من الهيئة.
Methodology
- Point-of-sale payments by card and mobile, from SAMA: 60 cities weekly, 30 activities for Saudi Arabia weekly (19 main and 11 sub-activities), and 60×30 monthly.
- Cash payments and online purchases are not included.
- City = location of the payment terminal, not where the buyer lives. Activity = the merchant’s classification at the bank.
- Figures are before removing price rises, so part of the growth is higher prices, not larger quantities.
- SAMA may revise its figures; we update earlier issues and say so here.
- All figures are published or calculated directly, except the “after inflation” column, which is an estimate.
What changed: Newsletter methodology 1.1. Added the week 25–31 October 2026 · 14–20 Jumada al-Ula 1448 AH.